Poultry Flock Profitability Analysis with Business Intelligence: A Practical Guide
Learn how to optimize your poultry farm's profitability using Business Intelligence. This article provides a step-by-step guide, from data collection to smart visualization, for more accurate and efficient business decisions.
In the highly dynamic poultry farming industry, profit margins are often very thin and vulnerable to various external and internal factors. Feed price fluctuations, high mortality rates, and the challenges of complex flock health management often make it difficult for farmers to identify the root causes of profitability problems. Decisions that rely only on intuition or delayed manual reports are no longer relevant in this data-driven era. Without in-depth and real-time analysis, potential major losses or opportunities to improve efficiency can be missed. Imagine if you could predict feed cost trends, proactively identify flocks with the worst performance, or even optimize harvest schedules based on accurate historical data. This is where Business Intelligence (BI) plays a crucial role. This article will be your practical guide to implementing BI in poultry flock profitability analysis, from understanding basic concepts, implementation details with specific tools, real code examples, to actionable best practices. We will discuss how raw data from the barn can be transformed into strategic insights that significantly increase your profits.
Basic Concepts of Business Intelligence in Poultry Farming
Business Intelligence (BI) is a set of processes, technologies, and strategies for transforming raw data into meaningful and actionable information, which ultimately supports better business decision-making. In the context of poultry farming, BI is not just about creating routine reports; it is about creating a data ecosystem that allows you to uncover hidden insights from daily operations. The BI cycle generally includes data collection, integration and transformation (ETL), data storage in a data warehouse, analysis, and visualization through interactive dashboards.
Why is BI so important for poultry farmers? This industry involves many interrelated variables: feed costs that can reach 60-70% of total production costs, mortality rates that must be suppressed, production performance (for example, FCR or Hen Day Production/HDP), barn environmental conditions, and fluctuations in market selling prices. Without BI, farmers often find it difficult to identify with certainty which factors most dominantly affect profitability. For example, does an increase in feed costs have a greater impact than a slight increase in mortality? Or, is there a correlation between suboptimal barn temperature and a decrease in FCR in a particular flock?
With BI, you can perform in-depth analysis such as comparing FCR performance between flocks or between periods, identifying patterns of increasing mortality that may indicate early health problems, or predicting feed needs based on projected growth and body weight. A concrete example: mortality data per flock can be integrated with feed consumption data, egg production data (for layers), and barn temperature/humidity data. From this combination of data, you can find that flock A, despite having slightly higher mortality, actually has better FCR due to superior feed management, or vice versa. BI allows you to see the big picture and the details simultaneously.
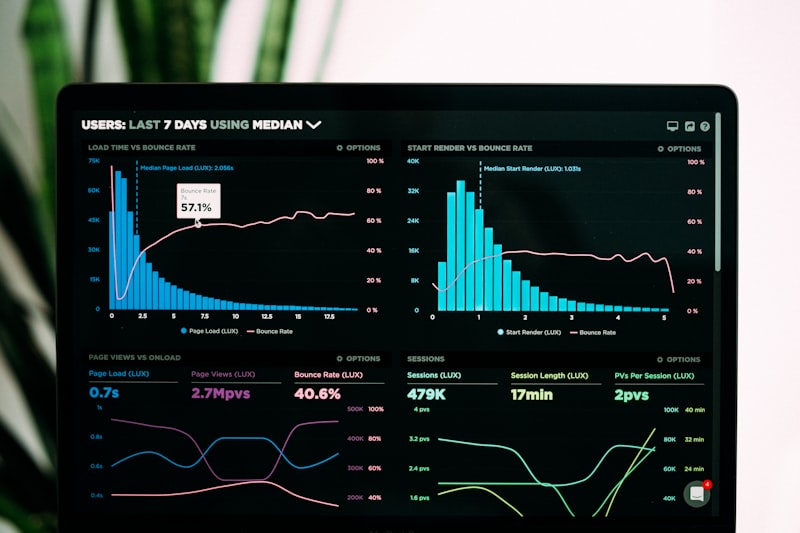
The benefits of implementing BI are very real. You can increase Return on Investment (ROI) by optimizing feed usage and reducing waste, reduce the risk of losses due to disease or poor performance through early detection, and make strategic decisions such as when the best time to harvest is or planning feed purchase schedules. With interactive dashboards, operational managers can monitor key performance indicators (KPIs) in real time, enabling quick responses to problems and continuous optimization. This is a leap from reactive to proactive management, providing a significant competitive advantage.
BI Implementation: From Raw Data to Interactive Dashboard
The first step in BI implementation is identifying and integrating data sources. In poultry farming, data sources can be very diverse. These include data from automated systems such as temperature, humidity, or automatic feed scales; data from digital systems such as Poultry ERP that records feed stock, purchases, sales, and flock information; and manual data such as daily mortality records, body weight sampling, or vaccination data that are often still in spreadsheet form. It is important to ensure consistency and accuracy of data across all sources.
After the data is collected, the next stage is the Extract, Transform, Load (ETL) process. This is the heart of any BI system. Extraction involves pulling data from various sources. For example, feed data from the Poultry ERP database (often using PostgreSQL 16), sensor data from MQTT or Kafka brokers, and mortality data from CSV or Excel files. The Transformation stage is the most crucial, where data is cleaned of anomalies, unified, and calculated into relevant metrics. Examples of transformations include calculating FCR (total feed divided by total body weight/eggs), Hen Day Production (HDP) for layers, average mortality per flock, or converting feed costs per kilogram of meat/eggs. After transformation, data is loaded (Load) into a Data Warehouse, a centralized data repository optimized for analysis, not for operational transactions. PostgreSQL 16 or ClickHouse are popular choices for a Data Warehouse due to their scalability and performance.
To perform efficient ETL processes, you can utilize programming languages such as Python along with the Pandas 2.x library. Pandas provides powerful data structures and flexible data analysis tools to clean, manipulate, and analyze data at scale. For visualization and building interactive dashboards, tools such as Apache Superset 2.1.1 or Metabase 0.48.x are highly recommended. Both are open-source platforms that are user-friendly and powerful, enabling you to create attractive charts, tables, and dashboards without needing in-depth programming expertise once the data is prepared.
Some key metrics that must be present in your BI dashboard include: FCR (Feed Conversion Ratio) per flock and per period, HDP (Hen Day Production) for laying hens, Mortality daily and cumulative per flock, Feed Cost per kilogram of production or per egg, Profit Margin per flock, and Average Body Weight (for broilers). By visualizing these metrics dynamically, you can quickly identify which flocks are performing below standard, worrying cost trends, or potential health issues that require immediate intervention. For example, if a flock's FCR suddenly worsens without a clear reason, this could be an early indication of a feed or health problem that needs investigation.
Example Poultry Profitability Data Analysis Code
This section will present real code examples that you can use as a basis for poultry flock profitability analysis. We will use SQL for basic data aggregation in the database and Python (with Pandas) for more complex analysis.
First, let's see how to calculate key metrics such as FCR and HDP using SQL. Assume we have a table log_produksi that records egg/body weight production and log_pakan that records feed consumption. Both tables have columns flock_id and tanggal.
-- SQL Query (PostgreSQL 16) untuk menghitung FCR dan HDP per flock per bulan
WITH ProduksiHarian AS (
    SELECT
        flock_id,
        DATE_TRUNC('month', tanggal) AS bulan,
        SUM(CASE WHEN jenis_produksi = 'telur' THEN jumlah_unit ELSE 0 END) AS total_telur_bulan,
        SUM(CASE WHEN jenis_produksi = 'daging' THEN berat_kg ELSE 0 END) AS total_daging_kg_bulan,
        COUNT(DISTINCT tanggal) AS hari_produksi
    FROM log_produksi
    GROUP BY flock_id, DATE_TRUNC('month', tanggal)
),
PakanHarian AS (
    SELECT
        flock_id,
        DATE_TRUNC('month', tanggal) AS bulan,
        SUM(konsumsi_kg) AS total_pakan_kg_bulan
    FROM log_pakan
    GROUP BY flock_id, DATE_TRUNC('month', tanggal)
)
SELECT
    p.flock_id,
    p.bulan,
    p.total_telur_bulan,
    p.total_daging_kg_bulan,
    p.hari_produksi,
    pa.total_pakan_kg_bulan,
    CASE
        WHEN p.total_daging_kg_bulan > 0 THEN pa.total_pakan_kg_bulan / p.total_daging_kg_bulan
        ELSE NULL
    END AS fcr_daging,
    CASE
        WHEN p.total_telur_bulan > 0 THEN pa.total_pakan_kg_bulan / p.total_telur_bulan
        ELSE NULL
    END AS fcr_telur_kg_per_butir,
    (p.total_telur_bulan::numeric / (p.hari_produksi * jumlah_ayam_awal_flock)) * 100 AS hdp_persen -- Asumsi jumlah_ayam_awal_flock tersedia
FROM ProduksiHarian p
JOIN PakanHarian pa ON p.flock_id = pa.flock_id AND p.bulan = pa.bulan
ORDER BY p.bulan, p.flock_id;
The SQL query above combines production and feed data to calculate FCR (Feed Conversion Ratio) and HDP (Hen Day Production) per flock each month. DATE_TRUNC('month', tanggal) is used to group data by month. FCR is calculated as total feed consumption divided by total production (meat or eggs). HDP is calculated as the percentage of daily egg production relative to the initial number of hens in the flock. It is important to adjust jumlah_ayam_awal_flock to your actual data.
Next, let's use Python with the Pandas library to perform a more in-depth profitability analysis, including cost and profit calculations per flock. Assume we have the result data from the SQL query above, plus other cost data such as mortality, medications, and selling price.
# Python Code (Python 3.10+, Pandas 2.x) untuk analisis profitabilitas per flock
import pandas as pd

# Contoh data (biasanya diambil dari database atau CSV)
data = {
    'flock_id': ['F001', 'F001', 'F002', 'F002'],
    'bulan': ['2023-01-01', '2023-02-01', '2023-01-01', '2023-02-01'],
    'total_telur_bulan': [10000, 10500, 9000, 9200], # butir
    'total_daging_kg_bulan': [0, 0, 1500, 1600], # kg
    'total_pakan_kg_bulan': [1200, 1250, 2000, 2100], # kg
    'mortalitas_ekor': [5, 3, 10, 8],
    'biaya_obat_rp': [100000, 50000, 150000, 120000],
    'harga_jual_telur_per_butir_rp': [1500, 1550, 0, 0],
    'harga_jual_daging_per_kg_rp': [0, 0, 25000, 26000],
    'biaya_pakan_per_kg_rp': [7500, 7600, 7000, 7100]
}
df = pd.DataFrame(data)
df['bulan'] = pd.to_datetime(df['bulan'])

# Hitung pendapatan
df['pendapatan_telur_rp'] = df['total_telur_bulan'] * df['harga_jual_telur_per_butir_rp']
df['pendapatan_daging_rp'] = df['total_daging_kg_bulan'] * df['harga_jual_daging_per_kg_rp']
df['total_pendapatan_rp'] = df['pendapatan_telur_rp'] + df['pendapatan_daging_rp']

# Hitung biaya
df['biaya_pakan_rp'] = df['total_pakan_kg_bulan'] * df['biaya_pakan_per_kg_rp']
df['total_biaya_rp'] = df['biaya_pakan_rp'] + df['biaya_obat_rp'] # Tambahkan biaya lain jika ada

# Hitung profitabilitas
df['profit_rp'] = df['total_pendapatan_rp'] - df['total_biaya_rp']
df['profit_margin_persen'] = (df['profit_rp'] / df['total_pendapatan_rp']) * 100

print(df[['flock_id', 'bulan', 'total_pendapatan_rp', 'total_biaya_rp', 'profit_rp', 'profit_margin_persen']].to_string())

# Contoh: Identifikasi flock dengan profit margin terendah
lowest_margin_flock = df.loc[df['profit_margin_persen'].idxmin()]
print(f"\nFlock dengan profit margin terendah:\n{lowest_margin_flock[['flock_id', 'bulan', 'profit_margin_persen']]}")
This Python script demonstrates how to calculate total revenue, total costs, profit, and profit margin per flock per month. The data used in this example is a representation of already aggregated data. The pd.to_datetime() function converts the month column into datetime format. Then, calculations are performed for revenue from eggs and meat, as well as costs for feed and medicine. Profit is calculated from the difference between revenue and costs. The final result is a DataFrame that displays the main profitability metrics, and we can also easily identify the flock with the lowest profit margin for further investigation. This is the foundation for your BI dashboard.
Data Integration and Anomaly Handling
Data integration is the backbone of a BI system. Data from various sources must be unified in a consistent format. In modern farming, this can mean integrating data from IoT (Internet of Things) devices such as temperature and humidity sensors, local ERP systems for feed and stock management, and mobile applications for mortality recording. Communication standards such as JSON or XML are often used for data transfer between systems. The following is an example JSON payload that might be sent from a daily recording system to the BI platform:
{
  "event_id": "MORT-20231115-001",
  "timestamp": "2023-11-15T08:30:00Z",
  "flock_id": "F003",
  "jenis_unggas": "Layer",
  "umur_hari": 120,
  "data_mortalitas": {
    "jumlah_ekor": 7,
    "penyebab_utama": "Newcastle Disease",
    "catatan": "Gejala pernapasan dan diare pada beberapa ekor. Segera dilakukan isolasi."
  },
  "data_pakan": {
    "konsumsi_kg": 150.5,
    "jenis_pakan": "Pelet Layer Fase 2",
    "stok_sisa_kg": 850.2
  },
  "data_lingkungan": {
    "suhu_rata_celsius": 28.5,
    "kelembaban_persen": 70.1
  },
  "lokasi_kandang": "Kandang A-3"
}
The JSON payload above represents a daily data snapshot from a flock, including mortality, feed consumption, and environmental conditions. A well-defined structure like this is important to ensure that data can be parsed and processed correctly by your BI system. You can use JSON Schema to validate the data structure before it enters the Data Warehouse, ensuring that each field has the correct data type and a valid value.
However, in practice, data anomalies often occur. These can be missing data, incorrect formats, or unreasonable values. One common error you might encounter during the ETL process is:
"Data type mismatch for 'berat_pakan_kg': expected numeric, got string. Row ID: 12345."
This error message indicates that the 'berat_pakan_kg' column, which should contain numbers, instead received a text value. This can happen due to manual input errors, sensor issues, or differences in data formats between source systems. Handling data anomalies is key to maintaining the integrity of your BI analysis. There are several strategies for handling them:
- Input Validation at Source: Implement strict validation at data collection points (for example, in recording applications or IoT devices) to prevent incorrect data from entering.
- Data Cleansing Process: Use ETL scripts (such as with Python Pandas) to identify and fix anomalies. This can be data type conversion, filling missing values (imputation), or deleting corrupted rows if correction is not possible.
- Logging and Notifications: Every time an anomaly is detected, record it in a log and send a notification to the operations or IT team so the issue can be investigated and fixed at its source.
- Data Schema Definition: Define a clear data schema for each source and ensure incoming data conforms to that schema. This can be done with tools such as Apache Avro or Protobuf, or even simple validation in Python.
- Robust Data Transformation: Create transformation logic that can handle minor data variations and convert them to a standard format.
With a systematic approach to integration and anomaly handling, you can ensure that data entering your BI system is high quality, producing accurate and reliable insights.
Best Practices in BI Implementation for Poultry Farming
- Define Key Metrics (KPIs) Clearly: Before starting, identify the Key Performance Indicators (KPIs) most relevant to your flock's profitability, such as FCR, HDP, mortality, feed cost per kg/egg, and profit margin. Clear definitions will guide data collection and analysis, ensuring you focus on what truly matters to the business.
- Prioritize Data Quality (Data Governance): Bad data produces bad insights. Ensure collected data is accurate, consistent, and complete. Implement standard procedures for data entry, validation, and regular audits. This may involve staff training or implementing automated validation systems in recording applications.
- Start Small, Then Scale: Don't try to build the perfect BI system all at once. Start with a pilot project on one or two flocks or one type of data (for example, only feed and production), prove its value, then gradually expand the scope of data and metrics analyzed. This approach reduces risk and allows continuous learning.
- Involve End Users (Farmers/Operations Managers): BI insights are only valuable if used. Involve farmers and operations managers from the start in designing dashboards and reports. Understand their needs, the types of questions they want to answer, and how they want to see data. This will ensure higher adoption and solution relevance.
- Choose the Right Tools According to Needs and Budget: There are many BI tools on the market, from open-source such as Apache Superset or Metabase to commercial solutions such as Tableau or Power BI. Consider your team's capabilities, data complexity, scalability needs, and available budget. Sometimes, a combination of several tools (for example, Python for ETL and Metabase for dashboards) is the best choice.
- Automate the ETL Process: The Extract, Transform, Load (ETL) process should be automated as much as possible. Scheduling Python scripts or specialized ETL tools will ensure data is always up to date without excessive manual intervention, reducing the potential for errors and freeing up IT team time. Use cron jobs on Linux or Windows Task Scheduler for scheduled execution.
- Perform Regular Audits and Maintenance: A BI system is not a one-time project. Conduct regular audits of data quality, query performance, and dashboard relevance. Update metric definitions if there are changes in business goals. This maintenance ensures the system remains relevant and effective over time.
- Focus on Actionable Insights: The main goal of BI is to produce actionable insights. Don't just present raw data; interpret trends, identify anomalies, and suggest corrective actions or optimization opportunities. Dashboards should be designed to facilitate identification of next actions, not just display numbers.
- Data Security is a Priority: Farm data, especially related to performance and costs, is a valuable asset. Ensure your BI system has strict access controls, adequate data encryption, and compliance with data privacy regulations if any. Consider multi-factor authentication for dashboard access.
FAQ
- Q1: What is the main difference between Business Intelligence (BI) and ordinary operational reports?
- A1: Ordinary operational reports are generally descriptive, showing what has happened (for example, total feed consumed last month). BI, on the other hand, is analytical and predictive. BI not only shows what happened, but also why it happened, what the trends are, and what might happen in the future, enabling proactive decision-making. BI integrates data from various sources for a more holistic and in-depth picture.
- Q2: Is BI implementation only suitable for large-scale poultry farms?
- A2: Not at all. Although large farms may have more resources, the benefits of BI can be enjoyed by medium to small-scale farms. The key is to start with clear needs and choose the right solution according to scale. Even with limited data, BI can help identify significant areas for improvement, making it relevant for operations of various sizes.
- Q3: What BI tools are recommended for beginners with a limited budget?
- A3: For beginners with a limited budget, a combination of Python (with the Pandas library) for ETL and Apache Superset or Metabase for visualization is an excellent choice. Both are feature-rich open-source platforms, have large communities, and are relatively easy to learn. PostgreSQL is also a strong open-source database option for storing your data warehouse.
- Q4: How long does it take to implement a basic BI system?
- A4: Implementation time varies greatly depending on the complexity of data sources, data volume, and team resource availability. For a basic BI system focused on a few key metrics from 2-3 data sources, you may need 3-6 months. A more comprehensive project with integration of many systems and predictive features could take 9-12 months or more.
- Q5: How do you address incomplete or inconsistent data?
- A5: This is a common challenge. Strategies include: first, identify the source of data problems and fix them at the root. Second, use data cleansing techniques during the ETL process (for example, mean/median imputation for missing data, format standardization). Third, apply strict data validation at the point of entry. Fourth, consider using cleaner historical data or ignoring severely corrupted data for certain analyses.
- Q6: Is investing in Business Intelligence worth the cost for poultry farms?
- A6: Yes, investing in BI is very worthwhile. With BI, you can identify previously unseen inefficiencies, optimize resource use (feed, medicines), reduce mortality, and make smarter selling price decisions. The resulting improvements in operational efficiency and profitability often far exceed the initial implementation cost, providing solid ROI in the long term.
Managing poultry farms in the modern era demands more than just field experience; it requires accurate and real-time data-driven insights. Business Intelligence offers a bridge between complex raw data and profitable strategic decisions. By implementing a BI system, you will not only understand what is happening on your farm, but also why, and more importantly, how you can optimize every aspect of operations to achieve maximum profitability. From better FCR to proactive disease risk management, the potential for increased profits is enormous. If you are ready to take your poultry farm to the next level with an integrated BI solution designed specifically for you, Nugroho Setiawan's team is ready to be your partner. With deep experience in ERP Poultry development, SIMRS, as well as expertise in data integration using the latest technologies such as PostgreSQL 16, Python Pandas 2.x, and Apache Superset 2.1.1, we offer consultation and custom BI system development tailored to your specific needs. Contact us today for further discussion or to schedule a demo of how our solutions can transform your farm operations.
This article is part of the education by Nugroho Setiawan, IT consultant Jogja. Related solutions: ERP Agriculture SIMRS. Need free consultation?
Komentar
Belum ada komentar. Jadilah yang pertama!
Saya membantu konsultasi IT, pengembangan aplikasi, dan visualisasi data untuk rumah sakit, klinik, dan bisnis di Yogyakarta (DIY), Magelang, dan sekitarnya.
Artikel Terkait
Baca juga artikel lainnya