Profitability Analysis per Flock with Business Intelligence: A Practical Guide
A technical guide to building per-flock profitability analysis for layer poultry operations with BI: metric definitions, star schema, SQL queries, dashboards, and operational decision thresholds.
On layer farms with a population of 12,000–50,000 birds and 4–8 active flocks, the question that most often comes up in monthly meetings is not how much total company profit is, but which flock is actually wasting money. The problem is classic: daily production is recorded in the barn, feed costs in a purchasing spreadsheet, egg sales in a POS application, and wages on separate slips. All those numbers never meet in the same definition of profitability, so decisions such as early culling, thinning, or changing feed formulation are made based on feeling. Yet feed accounts for 70–75% of total production cost, and a 5% HDP difference between flocks can mean tens of millions of rupiah per month. Business intelligence closes this gap: one data model, one metric definition, one dashboard used by the foreman, operations manager, and owner at once. This article guides the technical steps concretely.
Step 1: Establish the Definition of Profitability per Flock
The unit of analysis is the flock, not the barn. A flock is a batch of DOC that arrives on the same date and is culled together. Barns change occupants between periods, so if you analyze by barn, depreciation costs and production results will be mixed across batches. Set flock_id as the single key across the system, then attach all transactions to this ID. Costs that must be allocated: feed (write actual kg, not an estimate), OVK (medications, vaccines, vitamins, sanitation), barn labor, electricity and water, husk/litter/gas, depreciation of barns and equipment, and the cost of handling cracked and rejected eggs.
Core metrics that must be in the data dictionary: HDP (hen day production, % eggs against live population), FCR (kg feed per kg eggs), feed intake grams per bird per day, cumulative mortality, feed cost per kg eggs, full cost per kg eggs, IOFC (income over feed cost), and margin per flock. Every metric must have one official formula agreed by finance and operations — this is what distinguishes BI from a collection of charts.
Real example: Flock A 12,000 birds, HDP 82%, intake 115 g/bird/day, feed price Rp 8,600/kg, egg weight 60 g, selling price Rp 26,500/kg. Daily eggs 9,840 eggs = 590.4 kg, revenue Rp 15,645,600. Feed consumption 1,380 kg = Rp 11,868,000. IOFC = Rp 3,777,600 per day. Flock B with identical population but HDP 76% produces only 547.2 kg (Rp 14,500,800), IOFC Rp 2,632,800. The difference is Rp 1.14 million per day or about Rp 34 million per month from just two flocks. This is the number that should appear on the dashboard, not the company total.
Step 2: Build a Star Schema Data Model
The most durable model is a simple star schema. Three fact tables: fakta_produksi_harian (flock_id, kandang_id, tanggal, populasi_awal, mati, butir_layak_jual, berat_telur_kg, pakan_kg), fakta_penjualan_telur (tanggal, flock_id, kg, harga_rp), and fakta_biaya (tanggal, flock_id, akun_biaya, jumlah_rp). Dimensions: dim_flock (kode, tanggal_doc, strain, populasi_doc, status), dim_kandang, dim_pakan, and dim_waktu. The grain of the production fact is one row per flock per day — do not store monthly aggregates in the fact table, because you will need daily drill-down when investigating mortality spikes.
For ETL, if production recording is still in spreadsheets, daily loading into PostgreSQL 16 using Python 3.12 + pandas 2.2 is sufficient and finished within hours. If you already use a poultry ERP that records daily production per barn, just create a materialized view refreshed every 15 minutes. Visualization layer: Metabase 0.50 self-hosted for the operations team, Power BI for owners who need Excel export, or Grafana 11 if you want near real-time alerts. The following query calculates three key metrics per flock and can be pasted directly into Metabase as a native query.
WITH harian AS (
  SELECT p.flock_id, p.tanggal,
         SUM(p.butir_layak_jual)::numeric / NULLIF(MAX(p.populasi_awal),0) AS hdp,
         SUM(p.pakan_kg) AS pakan_kg,
         SUM(p.berat_telur_kg) AS telur_kg
  FROM fakta_produksi_harian p
  GROUP BY 1,2
)
SELECT f.kode_flock,
       ROUND(AVG(h.hdp)*100, 2) AS hdp_persen,
       ROUND(SUM(h.pakan_kg) / NULLIF(SUM(h.telur_kg),0), 3) AS fcr,
       ROUND(SUM(h.pakan_kg) * 8600 / NULLIF(SUM(h.telur_kg),0), 0) AS biaya_pakan_per_kg
FROM harian h JOIN dim_flock f USING (flock_id)
GROUP BY 1 ORDER BY 3;
Note the last column: feed cost per kg eggs is the most honest leading indicator. FCR 2.08 with a feed price of Rp 8,600 means Rp 17,888 per kg eggs from feed alone. Add non-feed costs (generally Rp 3,500–4,500 per kg eggs) to obtain full cost, then compare with the daily selling price from POS to see the actual margin of each flock.
Step 3: Compose the Dashboard and Decision Rules
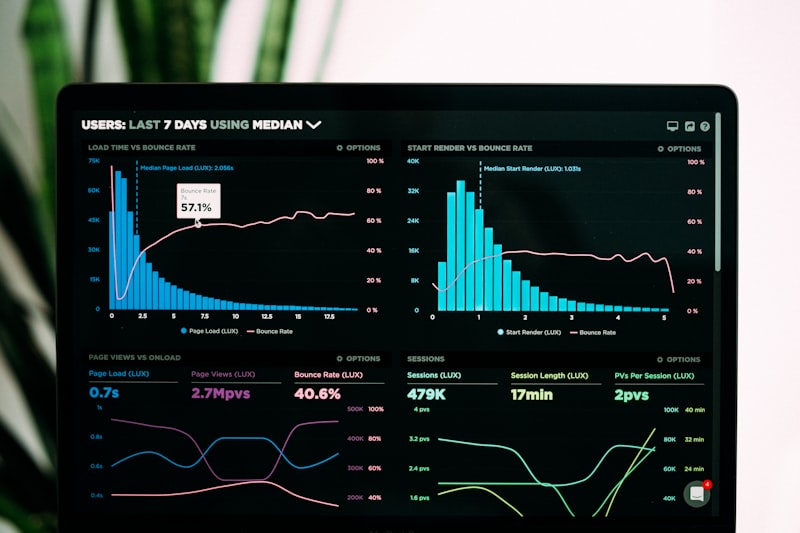
The dashboard is built in three layers so it does not end up as wall decoration. Executive layer: margin ranking per flock for the current month and contribution to total profit. Operational layer: daily HDP trend versus strain standard (Hy-Line Brown or Lohmann) in the same barn, cumulative FCR, and daily mortality. Diagnostic layer: production curve across the cycle, feed consumption per bird, and a scatter of HDP versus intake to detect underfeeding before it shows up in financial reports.
Set written decision thresholds. Example: negative margin per flock for three consecutive days triggers escalation to the operations manager; HDP 4% below the strain standard for two weeks triggers an audit of feed formulation and ventilation; feed cost per kg of eggs rising 8% from the rolling 30 days triggers a review of supplier contracts. The break-even egg price is calculated simply: total cost per kg of eggs. If the result is Rp 22,900/kg while the market is Rp 24,100/kg, you only have a buffer of Rp 1,200 per kg — enough to decide whether an old flock is worth culling sooner.
Automating alerts in Metabase only requires one saved question with a daily 06:00 schedule sent to email or a Telegram webhook. Its contents: a list of flocks with negative margin, FCR above target, and daily mortality above 0.08%. This way, the morning meeting runs based on the same data, not on the recollection of supervisors that differs from house to house.
Best Practices
- One metric definition, one place. Store all formulas in the data dictionary (dbt docs or a Metabase page) and version them; HDP calculated differently by finance and by the house will kill trust in the dashboard.
- Record feed in actual kg, not sacks. Convert sacks to kg using actual net weight; a 1 kg difference per sack at 1,380 kg/day becomes a bias of Rp 8,600 per day per flock.
- Separate leading and lagging indicators. Production, FCR, and intake are leading; margin and profit are lagging. The daily dashboard must be dominated by leading indicators.
- Refresh data at least daily before 05:00. Yesterday's data that only arrives at 10:00 makes thinning decisions one day late.
- Test reconciliation every month. Compare total kg of eggs in the sales fact with total production minus shrink and cracks; a difference above 1.5% indicates a recording problem, not a production problem.
FAQ
Do you have to have an ERP first before building BI?
No. Many farms start with structured Google Sheets (one row per flock per day) and then move them to PostgreSQL 16 via a Python script. ERP speeds things up because the data is already normalized, but a star schema model can still be built on top of a spreadsheet as long as the flock_id key is consistent.
How long does implementation take until the first dashboard can be used?
For 4–6 active flocks with historical data for the last 12 months, metric scoping and data cleaning usually take 1–2 weeks, and building the model and dashboard takes 1 week. What takes the most time is not the tools, but agreeing on the allocation of labor costs and depreciation per flock.
Which metrics are most important to monitor daily?
HDP, feed intake per bird, and mortality. All three move before margin. If HDP drops 2% while intake is stable, the cause is usually non-nutritional (water, ventilation, heat stress); if intake also drops, suspect feed or health.
What if eggs from several flocks are sold together?
Allocate revenue based on the proportion of kg of eggs produced by each flock that day, not based on house number. This keeps margin per flock comparable even though sales are centralized by a single warehouse.
Profitability analysis per flock is not a complicated enterprise project: one simple data schema, agreed-upon metric definitions, and aggregation queries are enough to turn monthly meetings into number-based decisions. If your team still relies on spreadsheet recaps and wants to build a flock dashboard connected directly to a poultry ERP, POS, or production system, we help with data architecture design through implementation for companies in Yogyakarta (DIY) and Magelang, Central Java — including IT consulting, SIMRS/SIM Klinik application development, ERP, POS, and websites. Start with an audit of the last 12 months of data, and you will know which flock needs attention this week.
This article is part of the knowledge base of Nugroho Setiawan, an IT consultant in Jogja (Yogyakarta). Related solutions: PilarPOS Agriculture ERP Clinic Management System. Need a free consultation?
Komentar
Belum ada komentar. Jadilah yang pertama!
Saya membantu konsultasi IT & pengembangan aplikasi untuk rumah sakit, klinik, dan bisnis di Yogyakarta (DIY), Magelang, dan sekitarnya.
Artikel Terkait
Baca juga artikel lainnya