Learn practical, in-depth steps to build an effective BI dashboard for the C-suite, especially in hospital and clinic settings. This article covers strategy, data architecture, tool selection, and code implementation examples, ensuring you can turn data into actionable strategic insights.
In this fast-paced digitalization era, strategic decision-making at the C-suite level of an organization, especially in the healthcare sector such as hospitals and clinics, can no longer rely on manual reports or stale data. Operations Managers, IT Directors, and clinic owners often face major challenges in presenting information that is relevant, timely, and easy for top decision-makers to digest. The abundant data from Hospital Management Information System (SIMRS), Clinic Management Information System (SIM Klinik), BPJS integration, and the SatuSehat platform (FHIR R4) is often trapped in silos, making it difficult for the C-suite to see the big picture of operational performance, finance, and patient satisfaction holistically. The need for a comprehensive and intuitive Business Intelligence (BI) dashboard is very crucial. An effective dashboard not only displays numbers but also tells a story about trends, performance, and areas that require immediate attention. This article will guide you practically and in depth on how to build a powerful BI dashboard for the C-suite, from basic concepts, implementation details with specific tool examples, to best practices and handling sensitive data in accordance with regulations.
Basic Concepts of Business Intelligence Dashboards for the C-suite
A Business Intelligence (BI) dashboard for the C-suite is a visual interface that presents strategic metrics and Key Performance Indicators (KPI) concisely and interactively, specifically designed to meet the information needs of top executives. Unlike operational dashboards that focus on daily details and granular metrics for frontline staff, the C-suite dashboard highlights the big picture relevant to the organization's strategic objectives. For example, in a hospital, the C-suite does not need individual per-patient medication transaction data, but rather trends in total pharmacy revenue, profitability ratios, or the efficiency level of operational budget usage. The goal is to facilitate fast, data-driven decision-making directed toward achieving long-term vision and mission.
The importance of this BI dashboard lies in its ability to transform complex raw data into easily understandable insights. Imagine the C-suite being able to view Bed Occupancy Rate (BOR) in real-time, Average Length of Stay (ALOS) per department, or patient satisfaction trends from survey results on one screen, without having to wait for time-consuming monthly reports. According to a study, organizations that utilize BI effectively can increase their profitability by up to 20-30%. In the healthcare sector, this means the potential for increased operational efficiency, optimized resource allocation, and improved patient service quality, which ultimately impacts the institution's financial health and reputation.
The main characteristics of a C-suite BI dashboard include clear and concise visualization, interactivity for drill-down to relevant detail levels, near real-time capability, and consolidation of data from various sources. Examples of relevant KPIs for the C-suite in a hospital or clinic include: Net Revenue per Patient, Operating Expense to Revenue Ratio, Return on Investment (ROI) of Technology Investment, BOR and TOI (Turn Over Interval), Average Service Waiting Time, Patient Satisfaction Index (NPS or CSAT), and Electronic Medical Record (RME) Compliance Rate based on PMK No. 24 of 2022. These metrics provide a comprehensive picture of organizational health, enabling the C-suite to identify problem areas, growth opportunities, and take corrective or strategic action quickly.
Developing this dashboard requires a deep understanding of the C-suite's information needs. Often, this process begins with a series of interviews or workshops to determine the most critical KPIs and the most effective visualization formats. For example, the Finance Director may be interested in revenue and cost trends, while the Medical Services Director will focus on service quality metrics and clinical efficiency. Therefore, the dashboard must be designed to be modular and customizable, presenting an executive summary followed by options to view further details if needed. This approach ensures that the dashboard is not only visually appealing but also highly functional and relevant to each segment of the C-suite.
The implementation of an effective BI dashboard can be a game-changer for healthcare institutions. With fast access to strategic insights, the C-suite can make smarter decisions regarding service expansion, investment in new technologies such as FHIR R4 integration for SatuSehat, or operational restructuring to improve efficiency. This is no longer a luxury but a necessity to remain competitive and adaptive amid the ever-evolving dynamics of the healthcare industry. The main focus is on delivering actionable information, not merely a pile of data.
Implementation Details: Building Data Architecture and Selecting Tools
Building a BI dashboard for the C-suite requires a robust data architecture and the right choice of tools. The first stage is to identify and integrate various data sources. In a hospital or clinic environment, the main data sources include SIMRS (Hospital Management Information System) such as OpenMRS or custom systems, SIM Klinik, ERP systems for financial and HR data, as well as data from integration platforms such as BPJS Kesehatan and SatuSehat that use the FHIR R4 standard. This data is often stored in different databases, for example PostgreSQL 16 for SIMRS, MySQL 8 for SIM Klinik, or even a RESTful API for SatuSehat. The challenge is how to unify and clean this data so that it is ready for analysis.
The data integration and transformation process (ETL - Extract, Transform, Load) is the backbone of every BI solution. For ETL, we can use tools such as Apache NiFi 1.25.0 for visually orchestrating data flows, or Apache Airflow 2.8.1 for scheduling and monitoring complex data pipelines. Another more flexible alternative is to build custom scripts using Python 3.10+ with libraries such as Pandas 2.2.0 for data manipulation and SQLAlchemy 2.0.28 for database connections. This script will extract data from primary sources, perform cleaning (handling null values, duplicates), transformation (calculating derived metrics such as BOR or ALOS), and load it into a Data Warehouse (DW).
A Data Warehouse is a centralized repository designed specifically for reporting and analysis. For medium scale, PostgreSQL 16 with a columnar store extension such as Citusdata can be a strong and cost-effective option. For large scale or cloud-native, Google BigQuery or AWS Redshift offer excellent scalability and performance. The DW will store data in a star schema or snowflake schema optimized for analytical queries, unlike OLTP (Online Transaction Processing) databases that are optimized for daily transactions. It is important to ensure that the data in the DW is sufficiently denormalized to facilitate queries and improve dashboard performance.
After the data is available in the Data Warehouse, the next step is to build the backend/API layer that will serve aggregated data to the frontend dashboard. For this, frameworks such as Laravel 11.x (with PHP 8.2+) or Node.js 20 LTS (with Express.js 4.19.2) are excellent choices. This backend will be responsible for retrieving data from the DW, applying additional business logic if needed, and serving it through a secure RESTful API. Using ORMs such as Eloquent in Laravel or Sequelize in Node.js can simplify interaction with the DW database. Authentication and authorization (for example with JWT or Laravel Sanctum) must also be implemented to ensure that only authorized users can access the data.
Finally, for dashboard visualization, there are several tool options. For self-hosted open-source solutions, Metabase 0.49.x or Apache Superset 3.0.x are highly recommended due to their ease of use, interactive features, and support for various data sources. If the budget allows and there is a need for broader ecosystem integration, commercial tools such as Microsoft Power BI or Tableau remain industry standards. Another alternative is to build a custom dashboard using frontend frameworks such as React 18 or Vue 3, combined with charting libraries such as Chart.js 4.x, D3.js 7.x, or ECharts 5.x. The choice of these tools must be tailored to your IT team's expertise, budget, and the complexity of your C-suite visualization needs. The key is to ensure that the chosen tool can connect to your Data Warehouse and is capable of presenting data interactively and responsively.
Example of Implementation Code and Data Integration
This section will present concrete code examples for the ETL (Extract, Transform, Load) process using Python and for creating an API endpoint using Laravel, which are two crucial components in building a BI dashboard architecture. This code is designed to be runnable and to provide a real picture of how data from SIMRS or SIM Klinik can be integrated into a Data Warehouse.
The following is an example snippet of Python code for a simple ETL that extracts patient visit data from a SIMRS database (for example PostgreSQL) and loads it into a fact table in the Data Warehouse:
import pandas as pd
from sqlalchemy import create_engine

# Koneksi ke sumber (SIMRS) dan target (DW)
source_engine = create_engine('postgresql://user:pass@simrs-host:5432/simrs')
dw_engine = create_engine('postgresql://user:pass@dw-host:5432/dw')

# Extract: ambil data kunjungan bulan lalu
df = pd.read_sql("""
    SELECT visit_id, patient_id, visit_date, department_id, diagnosis_code, total_cost
    FROM visits
    WHERE visit_date >= date_trunc('month', current_date - interval '1 month')
""", source_engine)

# Transform: tambahkan kolom turunan dan bersihkan data
df['visit_month'] = pd.to_datetime(df['visit_date']).dt.to_period('M').astype(str)
df['total_cost'] = df['total_cost'].fillna(0)

# Load: masukkan ke tabel fakta di DW
df.to_sql('fact_visits', dw_engine, if_exists='append', index=False)
print(f"Berhasil memuat {len(df)} baris ke fact_visits")
Meanwhile, for an API endpoint in Laravel that serves aggregate data for a C-suite dashboard, you can create a controller like the following:
// routes/api.php
Route::middleware('auth:sanctum')->get('/dashboard/kpi', [DashboardController::class, 'kpi']);

// app/Http/Controllers/DashboardController.php
public function kpi(Request $request)
{
    $data = DB::connection('dw')
        ->table('fact_visits')
        ->selectRaw("visit_month, COUNT(*) as total_visits, SUM(total_cost) as revenue")
        ->groupBy('visit_month')
        ->orderBy('visit_month')
        ->get();

    return response()->json([
        'status' => 'success',
        'data' => $data,
    ]);
}
The code above shows how data from SIMRS can be extracted, transformed, and loaded into a Data Warehouse, then presented through a secure API. Make sure to add scheduling (e.g., cron job) so ETL runs automatically, as well as logging and monitoring to detect failures.
Practical Tips for Building a BI Dashboard for C-suite
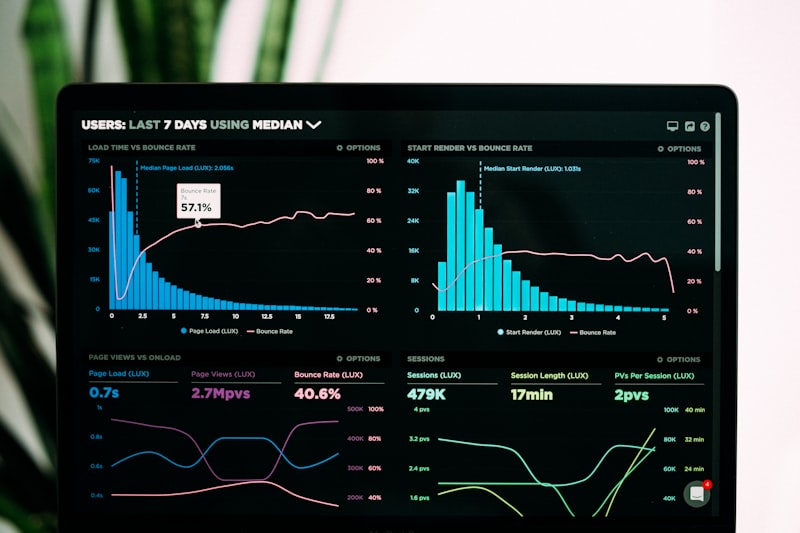
Building a dashboard for the C-suite is not just about presenting data, but presenting actionable insights. First, focus on one main business question per dashboard. The C-suite does not have time to browse dozens of charts; they want to know whether targets are met, where the problems are, and what should be done. Use KPIs such as bed occupancy, average length of stay (ALOS), BPJS claim ratio, and margin per service. Present them in the form of large number cards with trend indicators (up/down) and comparisons against targets or previous periods.
Second, design for mobile and fast access. Executives often access dashboards from tablets or phones during meetings. Ensure responsive layout, fast loading (under 3 seconds), and can be filtered by period, unit, or branch. Avoid overly dense tables; use visualizations such as line charts for trends, bar charts for comparisons, and heatmaps for distribution. Colors must be consistent and accessible (for example avoid red-green for color blind users).
Third, involve the C-suite from the start in defining metrics and the data narrative. Conduct discovery sessions to understand what decisions they want to make. After the dashboard is live, hold regular reviews and prepare a feedback mechanism. Do not forget the aspects of security and data governance: implement role-based access control (RBAC), audit logs, and ensure patient data is encrypted and complies with regulations (e.g., UU PDP). With this approach, the BI dashboard will become a strategic tool, not just a static report.
FAQ
Should a BI dashboard be real-time?
Not always. For the C-suite in the healthcare sector, near real-time data (e.g., refresh every 1-4 hours) is usually sufficient for strategic decision-making. Full real-time is more relevant for operations such as ED monitoring or bed availability. Adjust to needs and infrastructure costs.
How do you ensure data from SIMRS is accurate and consistent?
The main key is to build a validated ETL pipeline, implement data quality checks (e.g., detection of duplicates, null values, or anomalies), and document metric definitions clearly. Involve the medical records and finance teams for regular verification.
What tool is most suitable for IT teams with limited budgets?
Metabase or Apache Superset is the right choice because they are open-source, self-hosted, and have large communities. Both support connections to various databases and are fairly easy to configure. If the team has frontend capabilities, building a custom dashboard with React and Chart.js can also be a long-term alternative.
How do you measure the success of BI dashboard implementation?
Measure from adoption rate (number of active users), time saved in creating manual reports, and impact on business decisions such as improved operational efficiency or revenue. Conduct user satisfaction surveys regularly.
Conclusion
Building a Business Intelligence dashboard for the C-suite in the healthcare sector requires a blend of understanding business needs, solid data architecture, and appropriate visualization. Starting from SIMRS data integration, Data Warehouse development, tool selection, to security implementation, every step must be planned carefully. By following the guide and tips above, you can create a dashboard that is not only informative but also drives faster and more accurate strategic decisions.
If you want to accelerate implementation or need technical consultation tailored to your infrastructure and organizational needs, do not hesitate to contact our expert team. We are ready to help from architecture design, ETL development, to user training. Consult your healthcare BI dashboard needs now and realize digital transformation in your healthcare institution.
This article is part of education by Nugroho Setiawan, an IT consultant in Jogja. Related solutions: SIMRS SIM Klinik SatuSehat Bridging Integrator. Need free consultation?
Komentar
Belum ada komentar. Jadilah yang pertama!
Saya membantu konsultasi IT & pengembangan aplikasi untuk rumah sakit, klinik, dan bisnis di Yogyakarta (DIY), Magelang, dan sekitarnya.
Artikel Terkait
Baca juga artikel lainnya