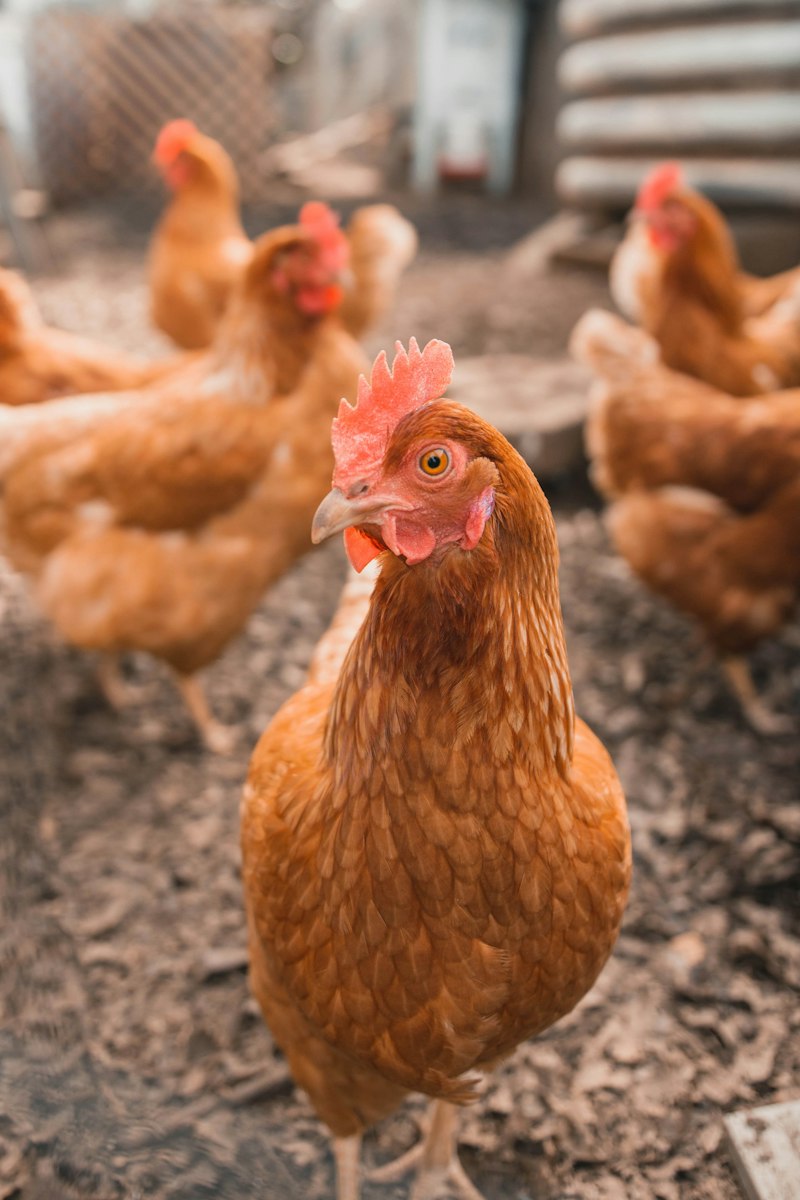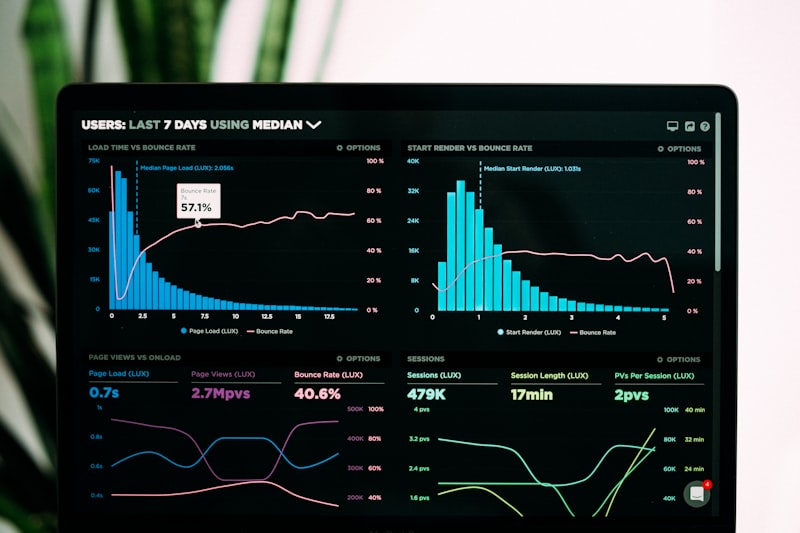
Learn how to automate FCR and Hen-Day Production reports to improve accuracy and speed up decision-making. This article covers system architecture, technical implementation, and best practices with real code examples, relevant across industries.
In today's fast-paced modern business landscape, efficient operational management is the key to success. Many organizations, from farms to hospitals, still struggle with manual reporting processes for crucial metrics. Take the livestock industry as an example: Feed Conversion Ratio (FCR) and Hen-day Production reports are vital indicators that are often collected and calculated manually, time-consuming, error-prone, and hinder rapid decision-making. Imagine the impact of a one-digit input error or an hours-long reporting delay on profit margins or flock health. This challenge is not limited to farms; operations managers across sectors face similar problems in tracking their key performance indicators (KPIs). This article will guide you in depth through the process of automating FCR and Hen-day Production reports, a case study showing how data automation principles can be applied to any complex operational metric. We will discuss system architecture, technical implementation details with specific tools, runnable code examples, error handling strategies, and best practices, all designed to provide concrete and actionable insights for IT Managers, business owners, and decision-makers.
Basic Concepts of FCR and Hen-Day Production, and the Urgency of Automation
Before going further into the technical aspects, let us first understand what FCR and Hen-day Production are, and why automating these two metrics is so crucial. FCR, or Feed Conversion Ratio, is an efficiency metric that measures how many kilograms of feed are needed to produce one kilogram of body weight or one kilogram of eggs. For example, an FCR of 1.7 means that 1.7 kg of feed is needed to produce 1 kg of product (meat or eggs). The lower the FCR value, the more efficient the feed use, which directly affects farm profitability. Accurate FCR calculation requires daily feed consumption data and precise production data (body weight or eggs).
Meanwhile, Hen-day Production (HDP) is the percentage of daily egg production from the total live laying hen population. The formula is (Daily Egg Count / Number of Live Hens) × 100%. An HDP of 80% means that for every 100 live hens, an average of 80 eggs are produced in a day. This metric is a direct indicator of flock productivity and overall hen health. Small changes in HDP can indicate health, nutrition, or environmental management problems, requiring rapid action. These two metrics, FCR and HDP, are the backbone of strategic decision-making in farm management.
The need for automation of FCR and Hen-day Production reports is non-negotiable in the digital era. First, data accuracy is fundamental. Manual reporting is prone to human error, both from field recording and data entry, which can lead to wrong decisions and significant financial losses. With automation, data is collected directly from its source, minimizing manual intervention. Second, real-time insights become possible. Managers can monitor daily or even hourly performance, enabling rapid response to anomalies or opportunities. This is far superior to weekly or monthly reports that are already outdated when received.
Third, time and resource efficiency. Automation frees staff from repetitive tasks such as manual data collection, calculations, and report creation, allowing them to focus on analysis, planning, and strategy implementation. Fourth, scalability. Automated systems are easily scaled to manage data from more farms or flocks without a proportional increase in labor. Finally, these automation principles do not only apply to farms. Operations managers in hospitals can automate reports on Bed Occupancy Rate, patient waiting times, or efficiency of medical equipment use. Clinic owners can automate service profitability analysis or patient retention. In essence, automating key metrics is the foundation for smart and responsive operations in any sector.
System Architecture and Technical Implementation
Building a robust FCR and Hen-day Production report automation system requires a well-planned architecture. This architecture must be able to handle data from various sources, process it efficiently, and present it in an easy-to-understand format. The following are the main components and recommended specific technology choices:
1. Data Sources: Raw data can come from various points. For FCR and Hen-day, these include automatic feed scales, egg counter sensors, chicken weight sensors (if available), and structured manual input through mobile or web applications. Other data such as the number of dead chickens or flock transfers are also important. This data can also come from an existing farm ERP system.
2. Data Ingestion: For real-time data streams from sensors or IoT devices, a message queue system is ideal. We recommend Apache Kafka 3.6.1 or RabbitMQ 3.12.10. Kafka is very suitable for high data volumes and streaming needs, while RabbitMQ is lighter and ideal for point-to-point messaging scenarios. This ensures data is received reliably and queued if there is a traffic spike.
3. Data Storage: Operational data requires a combination of databases. For relational data such as flock master data (name, start date, initial count), feed type, and structured daily records, PostgreSQL 16 is a very strong and reliable choice. For time-series data from sensors (for example, feed scale readings per minute), InfluxDB 2.7 offers superior performance in storing and querying time-based data. This separation optimizes performance and scalability.
4. Data Processing: This is the core of the system, where FCR and Hen-day calculations are performed. We recommend an application backend built with Laravel 11.x (using PHP 8.3) or Node.js 20 LTS (with the Express 4.19.2 framework). This application will receive data from the message queue, store it in the appropriate database, and execute the calculation logic. This process can be triggered on a schedule (for example, hourly or daily) or in real-time as new data arrives.
5. Reporting & Visualization: Processed data must be presented intuitively. Grafana 10.4.2 is a very powerful visualization tool, capable of connecting to PostgreSQL and InfluxDB simultaneously to create interactive dashboards. Alternatively, custom dashboards can be built using frontend frameworks such as Vue.js 3.x or React 18.x, which consume data via RESTful APIs provided by the backend application. These dashboards can display FCR trends, HDP, comparisons between flocks, and alerts for anomalies.
6. API Integration: For interaction with other systems, such as existing farm ERP or warehouse management systems, the backend application must provide well-defined RESTful APIs. Standards such as OpenAPI (Swagger) can be used to document these APIs. Although FCR and Hen-day are not directly related to FHIR or HL7 standards, the principles of robust data integration remain relevant, and if the organization has integrated health systems, an understanding of these standards will be beneficial for future expansion.
With this modular architecture, each component can be developed, tested, and scaled independently, ensuring a robust, efficient, and maintainable system. Data security must also be a priority at every layer, from API authentication to data encryption in the database.
Code Implementation Example
This section will present concrete code examples for the database schema and basic FCR and Hen-day Production calculation logic. We will use PostgreSQL for the database schema and PHP with the Laravel framework for the calculation logic, considering Nugroho Setiawan's experience with ERP and web development.
1. PostgreSQL Database Schema
The following is an example table schema for recording flock data (flocks) and daily records (daily_records) that will be used for calculations. This structure is designed for simplicity yet remains functional for demonstration purposes.
-- Tabel untuk Kawanan Ayam (Flocks)CREATE TABLE flocks ( id SERIAL PRIMARY KEY, name VARCHAR(255) NOT NULL, start_date DATE NOT NULL, total_chick INT NOT NULL, -- Jumlah ayam awal saat kawanan dimulai current_live_hens INT DEFAULT 0, -- Jumlah ayam hidup saat ini, diperbarui harian created_at TIMESTAMP DEFAULT CURRENT_TIMESTAMP, updated_at TIMESTAMP DEFAULT CURRENT_TIMESTAMP);-- Tabel untuk Catatan Harian (Daily Records)CREATE TABLE daily_records ( id SERIAL PRIMARY KEY, flock_id INT NOT NULL, record_date DATE NOT NULL, live_hens INT NOT NULL, -- Jumlah ayam hidup pada tanggal tersebut total_eggs INT NOT NULL, -- Total telur yang dikumpulkan pada tanggal tersebut total_feed_consumed_kg NUMERIC(10, 2) NOT NULL, -- Total pakan yang dikonsumsi (kg) mortality_count INT DEFAULT 0, -- Jumlah ayam mati pada tanggal tersebut created_at TIMESTAMP DEFAULT CURRENT_TIMESTAMP, updated_at TIMESTAMP DEFAULT CURRENT_TIMESTAMP, CONSTRAINT fk_flock FOREIGN KEY(flock_id) REFERENCES flocks(id), UNIQUE(flock_id, record_date) -- Memastikan hanya ada satu record per kawanan per hari);Explanation: The flocks table stores basic information about each chicken flock, including the initial number of chickens. The daily_records table is where daily operational data is recorded, such as the number of live hens, total eggs, and feed consumption. The live_hens column in daily_records is the number of live hens on that day, which can differ from current_live_hens in the flocks table (which is an aggregate). The UNIQUE(flock_id, record_date) column ensures data integrity by preventing duplicate daily records for the same flock. The mortality_count column is important for updating the number of live hens in the flock.
2. FCR and Hen-day Production Calculation Logic (Laravel 11.x, PHP 8.3)
The following is an example service class or method in a Laravel controller responsible for calculating FCR and Hen-day Production based on daily data. Assume we have Eloquent models for Flock and DailyRecord.
<?phpnamespace App\'Services;use App\Models\Flock;use App\Models\DailyRecord;use Carbon\Carbon;class ProductionReportService{    public function calculateDailyReport(int $flockId, string $date): array    {        $flock = Flock::find($flockId);        if (!$flock) {            throw new \Exception('Flock not found.');        }        $recordDate = Carbon::parse($date);        $dailyRecord = DailyRecord::where('flock_id', $flockId)
            ->where('record_date', $recordDate->toDateString())
            ->first();
        if (!$dailyRecord) {
            throw new \Exception('Daily record not found for the specified flock and date.');
        }
        // Perhitungan Hen-day Production (HDP)
        $henDayProduction = 0;
        if ($dailyRecord->live_hens > 0) {
            $henDayProduction = ($dailyRecord->total_eggs / $dailyRecord->live_hens) * 100;
        }
        // Perhitungan Feed Conversion Ratio (FCR)
        // Untuk FCR, kita perlu tahu total bobot telur atau bobot badan yang dihasilkan.
        // Dalam contoh ini, kita asumsikan 1 telur = 0.06 kg (rata-rata), atau bisa disesuaikan.
        // Jika ada data bobot badan, akan lebih akurat.
        $totalEggWeightKg = $dailyRecord->total_eggs * 0.06; // Asumsi rata-rata 60 gram per telur
        $feedConversionRatio = 0;
        if ($totalEggWeightKg > 0) {
            $feedConversionRatio = $dailyRecord->total_feed_consumed_kg / $totalEggWeightKg;
        }
        return [
            'flock_id' => $flockId,
            'record_date' => $recordDate->toDateString(),
            'live_hens' => $dailyRecord->live_hens,
            'total_eggs' => $dailyRecord->total_eggs,
            'total_feed_consumed_kg' => $dailyRecord->total_feed_consumed_kg,
            'hen_day_production' => round($henDayProduction, 2), // Pembulatan 2 desimal
            'feed_conversion_ratio' => round($feedConversionRatio, 2) // Pembulatan 2 desimal
        ];
    }
    // Metode lain untuk menghitung FCR kumulatif, HDP mingguan, dll. bisa ditambahkan di sini.}
Code Explanation: The calculateDailyReport function takes flockId and date as input. First, it searches for the relevant flock data and daily record. Then, it calculates Hen-day Production using the formula described earlier. For FCR, an assumption of average egg weight (0.06 kg) is used. In a real implementation, this value can be taken from configuration or master data. This code provides a solid foundation for daily calculations. Similar methods can be developed for calculating cumulative FCR, weekly HDP, or other relevant metrics, by aggregating data from several days or a period of time. It is important to ensure that all assumptions and constants (such as average egg weight) are well documented and configurable.
Data Integration and Error Handling
Seamless data integration and robust error handling strategies are crucial elements in automation systems. Without both, the system can become a source of confusion and unreliable data. Data entering the system can come from various sources, ranging from IoT sensors to manual input through a user interface.
Example of a Realistic Data Payload
When data is sent from an IoT device or mobile application to the backend, it is usually in JSON format via a RESTful API. The following is an example of a JSON payload that might be sent for a single daily record:
{ "flock_id": 101, "record_date": "2024-05-20", "live_hens": 980, "total_eggs": 780, "total_feed_consumed_kg": 125.50, "mortality_count": 5}This payload will be received by an API endpoint in the backend application (for example, POST /api/daily-records). The application will then validate this data, save it to a database (such as PostgreSQL), and trigger the FCR and Hen-day Production calculation process.
Example Error Messages and How to Handle Them
Although data validation has been performed on the client side (if any), server-side validation is absolutely necessary. Errors can occur due to invalid data, network issues, or violated business logic. The following is an example of an error message that might be received if the submitted data is invalid:
{ "status": "error", "code": 400, "message": "Invalid data provided.", "errors": { "live_hens": ["Jumlah ayam hidup harus merupakan bilangan bulat positif.", "Jumlah ayam hidup (980) tidak boleh melebihi total ayam awal kawanan (970)."], "total_feed_consumed_kg": ["Total pakan harus berupa angka positif."] }}Effective error handling includes several strategies:
- Strict Data Validation: Apply validation at every layer, from API input validation in the backend (using libraries such as Laravel Validator) to database-level constraints (for example, UNIQUE constraints, NOT NULL). This prevents dirty data from entering the system and causing incorrect calculations.
- Comprehensive Logging: Every error, even a minor one, must be logged. Use a centralized logging system such as the ELK Stack (Elasticsearch, Logstash, Kibana) or Splunk to collect logs from all system components. Logs must include timestamp, error level, error message, and relevant context (for example, request ID, failed payload). This makes debugging and root cause identification easier.
- Alerting System: For critical errors (for example, data pipeline failures, calculations that produce extreme anomalous values), configure an automated alerting system. Alerts can be sent via email, SMS, Slack, or incident management platforms such as PagerDuty. Operations managers or the IT team must be notified immediately to take corrective action.
- Retry and Idempotency Mechanism: For transient errors (for example, network issues), implement retry logic on the data sender side. Ensure that the operations performed are idempotent, meaning that sending the same request repeatedly will not cause unwanted side effects (for example, duplicate data). This can be achieved by using unique transaction IDs.
- Data Reconciliation Strategy: If there are data discrepancies between the source system and the reporting system, there must be a procedure to reconcile them. This may involve daily exception reports that highlight discrepancies, or specialized tools to compare and correct data. Periodic automated data verification with manual data samples can also help build trust.
Best Practices
Building an effective and sustainable automation system requires more than just working code. Here are the best practices you should apply to ensure the long-term success and scalability of your system:
- Layered and Strict Data Validation: Implement data validation at every entry and processing point. Start from validation on the UI/API side, validation at the backend service level, to data integrity constraints in the database (for example, NOT NULL, UNIQUE, FOREIGN KEY, and CHECK constraints). This is the first line of defense against dirty data that can compromise report accuracy.
- Scalable and Efficient Database Design: Use database design patterns that support rapid data growth. This includes using appropriate indexes on frequently queried columns, partitioning large tables by date or flock ID, and balanced normalization to avoid redundancy without sacrificing query performance. Also consider using databases optimized for time-series such as InfluxDB for sensor data.
- Comprehensive Logging and Monitoring: Implement a centralized logging system (for example, ELK Stack or Grafana Loki) to collect logs from all system components. Monitor system performance metrics in real-time (for example, CPU usage, memory, API latency, message queues) and data anomalies (for example, FCR values that suddenly spike). A good monitoring dashboard can provide early warnings of potential problems.
- Layered Data Security: Ensure data is protected at every stage. Use encryption when data is in transit (HTTPS/TLS) and when data is stored (disk encryption or encryption of sensitive columns). Implement strict role-based access control (RBAC), ensuring only authorized users can access or modify certain data. Perform audit trails to track who did what and when.
- Modular and Microservices-Based Architecture: Separate system functionality into smaller, independent components (for example, data acquisition service, calculation service, reporting service). This architecture facilitates development, testing, deployment, and scalability. If one component has a problem, other components will not be affected as a whole.
- Comprehensive Automated Testing: Develop unit tests for each calculation function, integration tests to ensure interactions between components run smoothly, and end-to-end tests to verify the full workflow from data input to final reports. Automated testing is essential to ensure the reliability of calculations and prevent regressions when code changes occur.
- Clear and Up-to-Date System and API Documentation: Document every aspect of the system, from architecture, database schema, API endpoints (using the OpenAPI/Swagger specification), to deployment and troubleshooting guides. Good documentation is invaluable for onboarding new team members, facilitating maintenance, and resolving issues quickly.
- Regular Technology Updates: Always update the tools, frameworks, and libraries used to the latest versions regularly. This not only provides access to new features and performance improvements, but more importantly, ensures your system is protected from security vulnerabilities found in older versions. Plan update schedules regularly.
- Backup and Disaster Recovery Strategy (DRP): Implement a daily or even hourly data backup strategy, depending on the criticality of the data. Store backups in physically separate locations. Develop and routinely test a disaster recovery plan (Disaster Recovery Plan) to ensure you can restore the system and data to operational condition within an acceptable time if a severe system failure occurs.
FAQ
- What are the main benefits of FCR and Hen-day report automation for my operations?
The main benefit is a significant increase in data accuracy, because automation reduces human intervention and potential input errors that often occur in manual processes. In addition, automation enables access to data and reports in real-time or near real-time, enabling faster and evidence-based decision making. It also frees up human resources from repetitive and time-consuming manual tasks, allowing them to focus on data analysis, strategy, and other higher-value operational improvements.
- What tools are recommended for building this automation system as a whole?
For the backend, we recommend frameworks such as Laravel 11.x (PHP 8.3) or Node.js 20 LTS with Express 4.19.2, both of which are very flexible and have large communities. For the database, PostgreSQL 16 is a strong and reliable choice for relational data, while InfluxDB 2.7 is suitable for time-series data from sensors. Visualization and reporting can be done with the powerful Grafana 10.4.2 or a custom dashboard using modern frontend frameworks such as React 18.x or Vue.js 3.x. For message queues, Apache Kafka 3.6.1 or RabbitMQ 3.12.10 are solid choices.
- How can I ensure the accuracy of data from the IoT sensors used?
The accuracy of data from IoT sensors can be ensured through several important steps. First, perform routine sensor calibration according to the applicable manufacturer or industry standards to maintain measurement precision. Second, apply data filtering algorithms on the device or backend side to remove noise, invalid outliers, or readings outside the logical range. Third, implement cross-validation mechanisms with other data sources or logical thresholds to help identify sensor inaccuracies or failures early.
Of course, this system is designed with modularity principles so it is very possible to be integrated with the ERP already existing in your organization. The most common and recommended integration method is through RESTful API, where data can be exchanged programmatically between the automation system and your ERP. Other alternatives include scheduled CSV/Excel file exchange or direct connection to the ERP database, although the API method is generally more recommended for scalability, security, and real-time capabilities. We can help design a suitable integration bridge.
Implementation time and cost vary widely and depend on project scale, integration complexity, and the availability of internal resources and expertise. For a simple system with a few sensors and basic reports, it might take 2-4 months with costs of tens to hundreds of millions of rupiah. More complex projects with deep integration into other systems, extensive custom features, and very large data volumes can take 6 months to over a year, with a larger investment, often in the range of hundreds of millions to billions of rupiah, depending on the total project scope.
Handling historical data involves the process of migrating old data into a new database structure designed for the automation system. This process often requires custom ETL (Extract, Transform, Load) scripts to clean, format, and bulk import old data. It is important to ensure data integrity during migration and perform careful cross-validation after the process is complete to verify the accuracy of the transferred data. The system must also be designed to efficiently analyze historical data, enabling performance comparisons over time and identification of long-term trends to support predictive analysis.
Automating FCR and Hen-day Production reports is not merely an efficiency improvement, but a fundamental transformation in the way you manage operations. With accurate, real-time, and easily accessible data, you can make smarter, faster, and more precise decisions, which ultimately will drive your business's profitability and sustainability. The principles discussed in this article, from system architecture to error handling and best practices, can be adapted to automate complex operational metrics across various industries, from healthcare to manufacturing. If you are a Hospital IT Manager, clinic owner, operations manager, or decision maker looking for innovative technology solutions to optimize your operations, we are ready to help. Nugroho Setiawan and the team have deep expertise in SIMRS, ERP (including ERP Poultry/Layer), data integration (BPJS/SatuSehat/FHIR), and robust custom system development. Contact us today for a free consultation and find out how we can design the right automation solution for your organization's specific needs. Visit our website at https://nugrohosetiawan.com or email info@nugrohosetiawan.com.
This article is part of the education by Nugroho Setiawan, IT consultant in Jogja. Related solutions: ERP Agriculture SIMRS Integrator Bridging SatuSehat. Need a free consultation?
Komentar
Belum ada komentar. Jadilah yang pertama!
Saya membantu konsultasi IT & pengembangan aplikasi untuk rumah sakit, klinik, dan bisnis di Yogyakarta (DIY), Magelang, dan sekitarnya.
Artikel Terkait
Baca juga artikel lainnya